Daniel Nevo
  • Home
  • Research & Collaborations
  • Publications
  • Group
  • Teaching
  • CV

Teaching

Courses taught by Daniel Nevo at Tel Aviv University.
Teaching

My teaching spans causal inference, biostatistics, statistical models, generalized linear models, and research seminars.

Tel Aviv University

Causal Inference

Graduate level · 2019, 2021, 2022, 2024, 2026

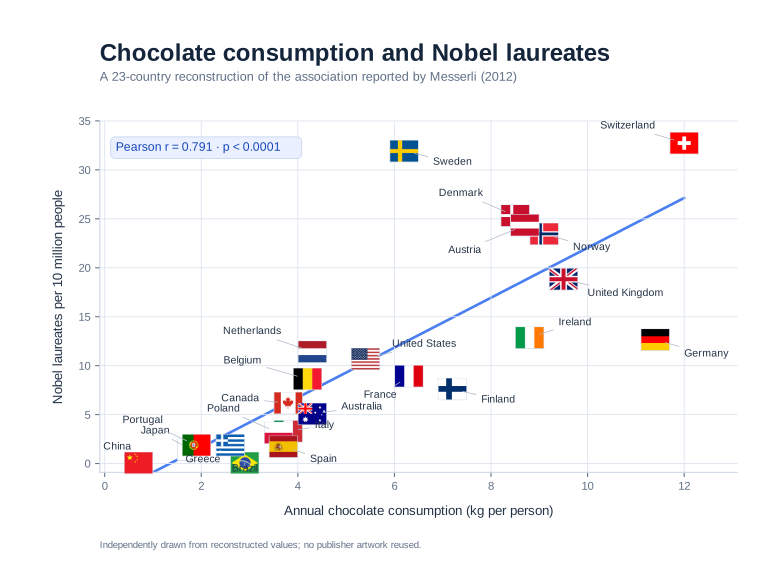
Independently redrawn country-level scatterplot of annual chocolate consumption and Nobel laureates, with national flags marking 23 observations and a fitted trend line; the figure reports Pearson r = 0.791 and p < 0.0001. Enlarge ↗
Chocolate consumption and Nobel laureates. Independently redrawn from reconstructed values based on F. H. Messerli, NEJM (2012); flag artwork from flag-icons (MIT).

Statistical Models B

2021, 2022, 2023, 2024

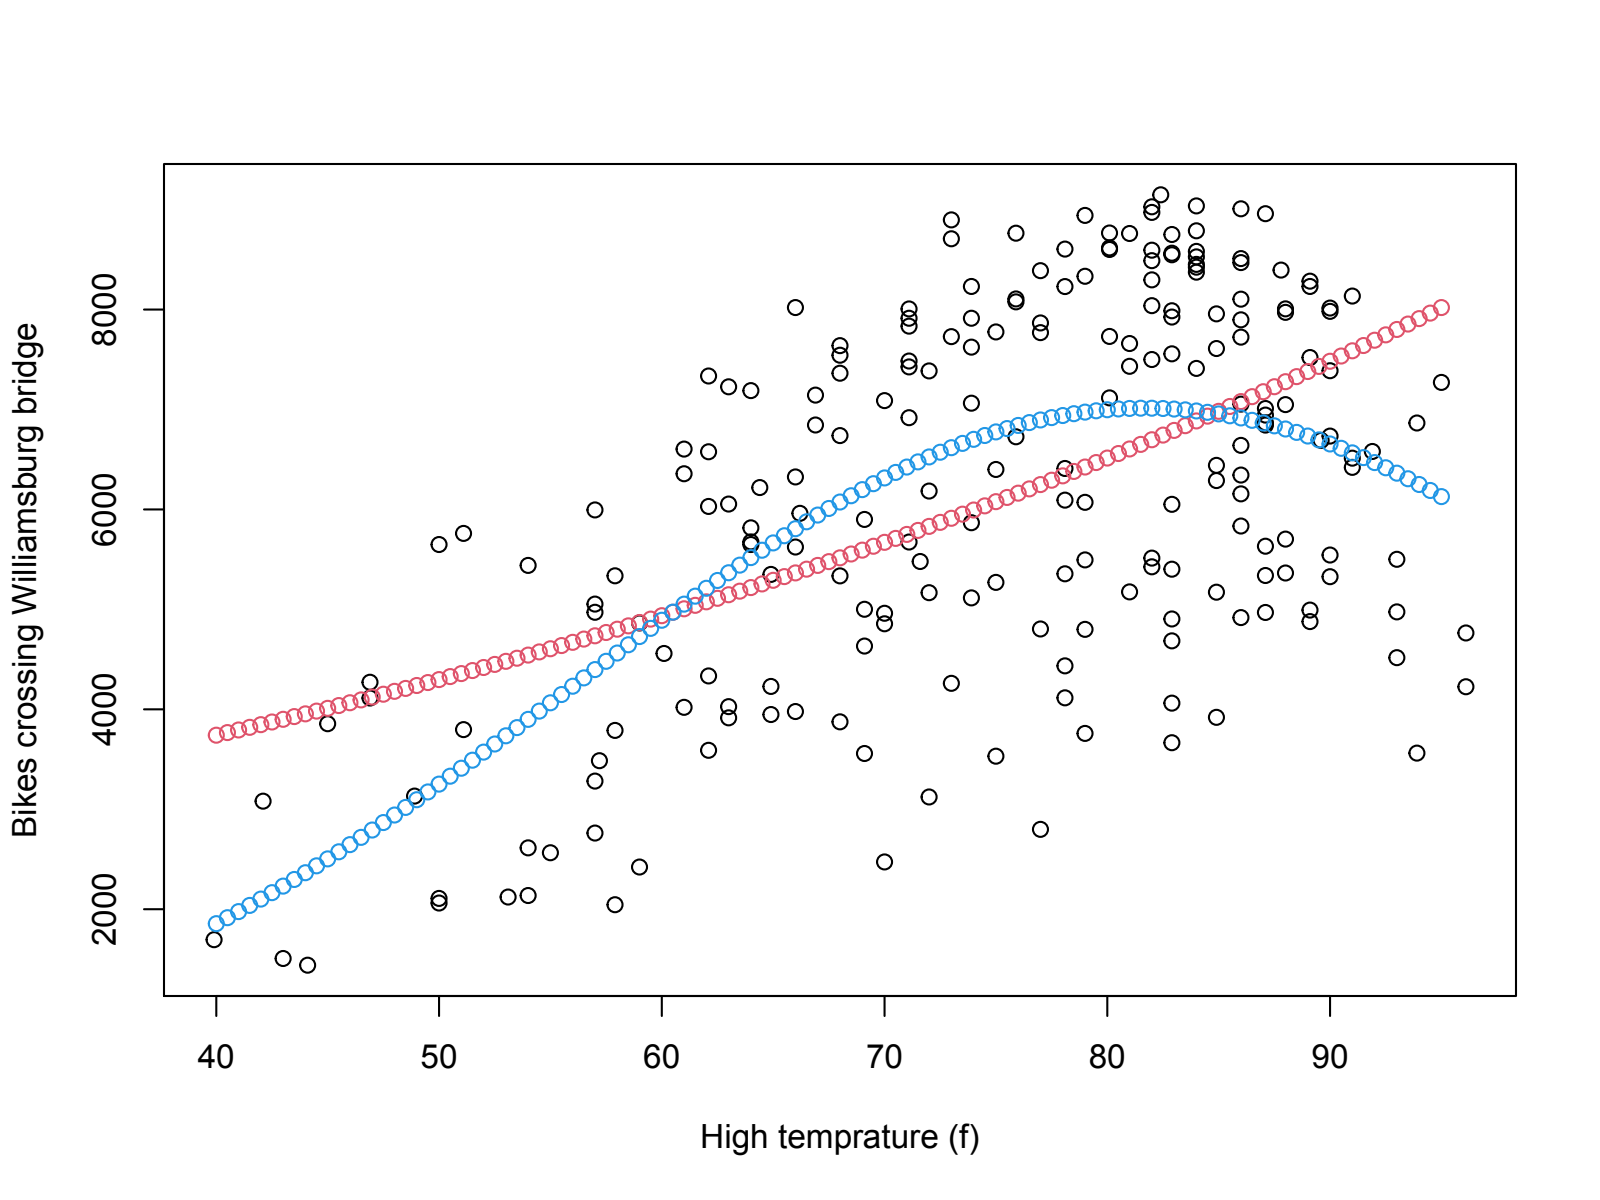
Observed bicycle counts on the Williamsburg Bridge plotted against temperature, with two different fitted model curves. Enlarge ↗
Modelling bicycle traffic and temperature. From the course figures.

Seminars in Statistics

MSc Seminar · 2021, 2022; BSc Seminar · 2024

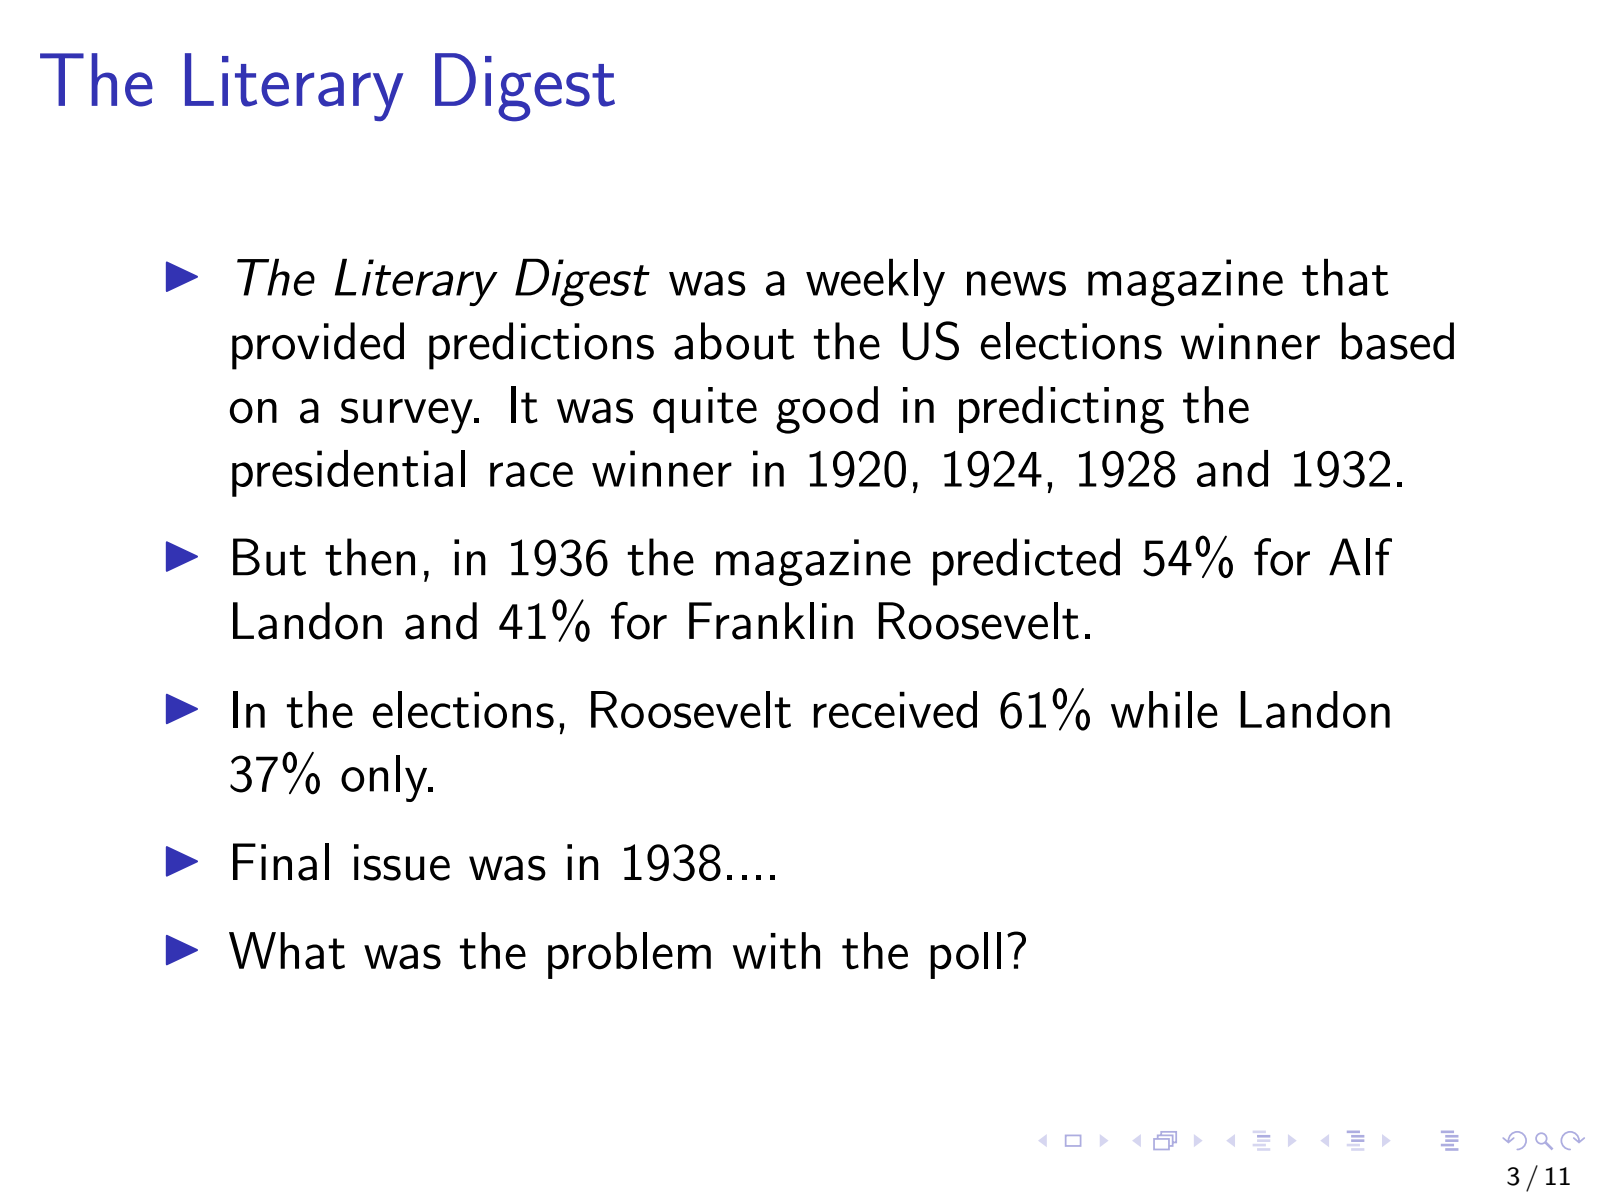
Introductory seminar slide asking why the Literary Digest poll failed to predict the winner of the 1936 US presidential election. Enlarge ↗
What went wrong with the poll? From the BSc Seminar’s introductory lecture.

Generalized Linear Models

Graduate level · 2023

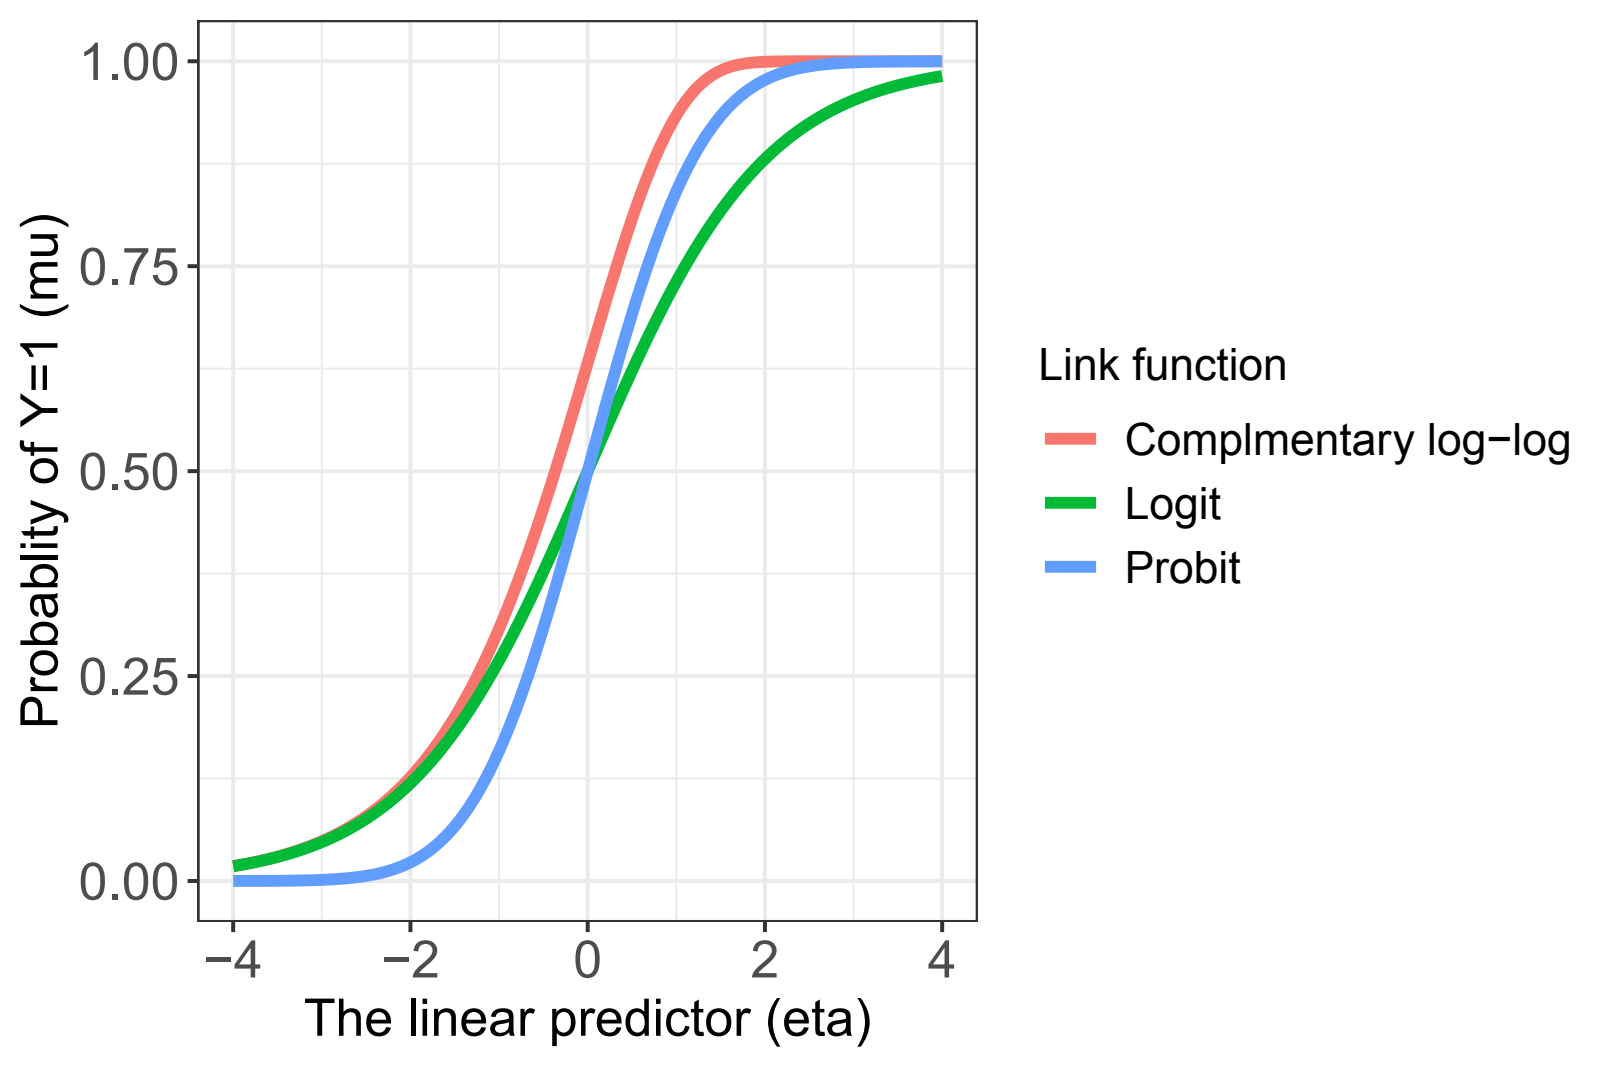
Logit, probit, and complementary log-log curves mapping the linear predictor to the probability of a binary outcome. Enlarge ↗
Three link functions for binary outcomes. From the course figures.

Biostatistical Methods

2020

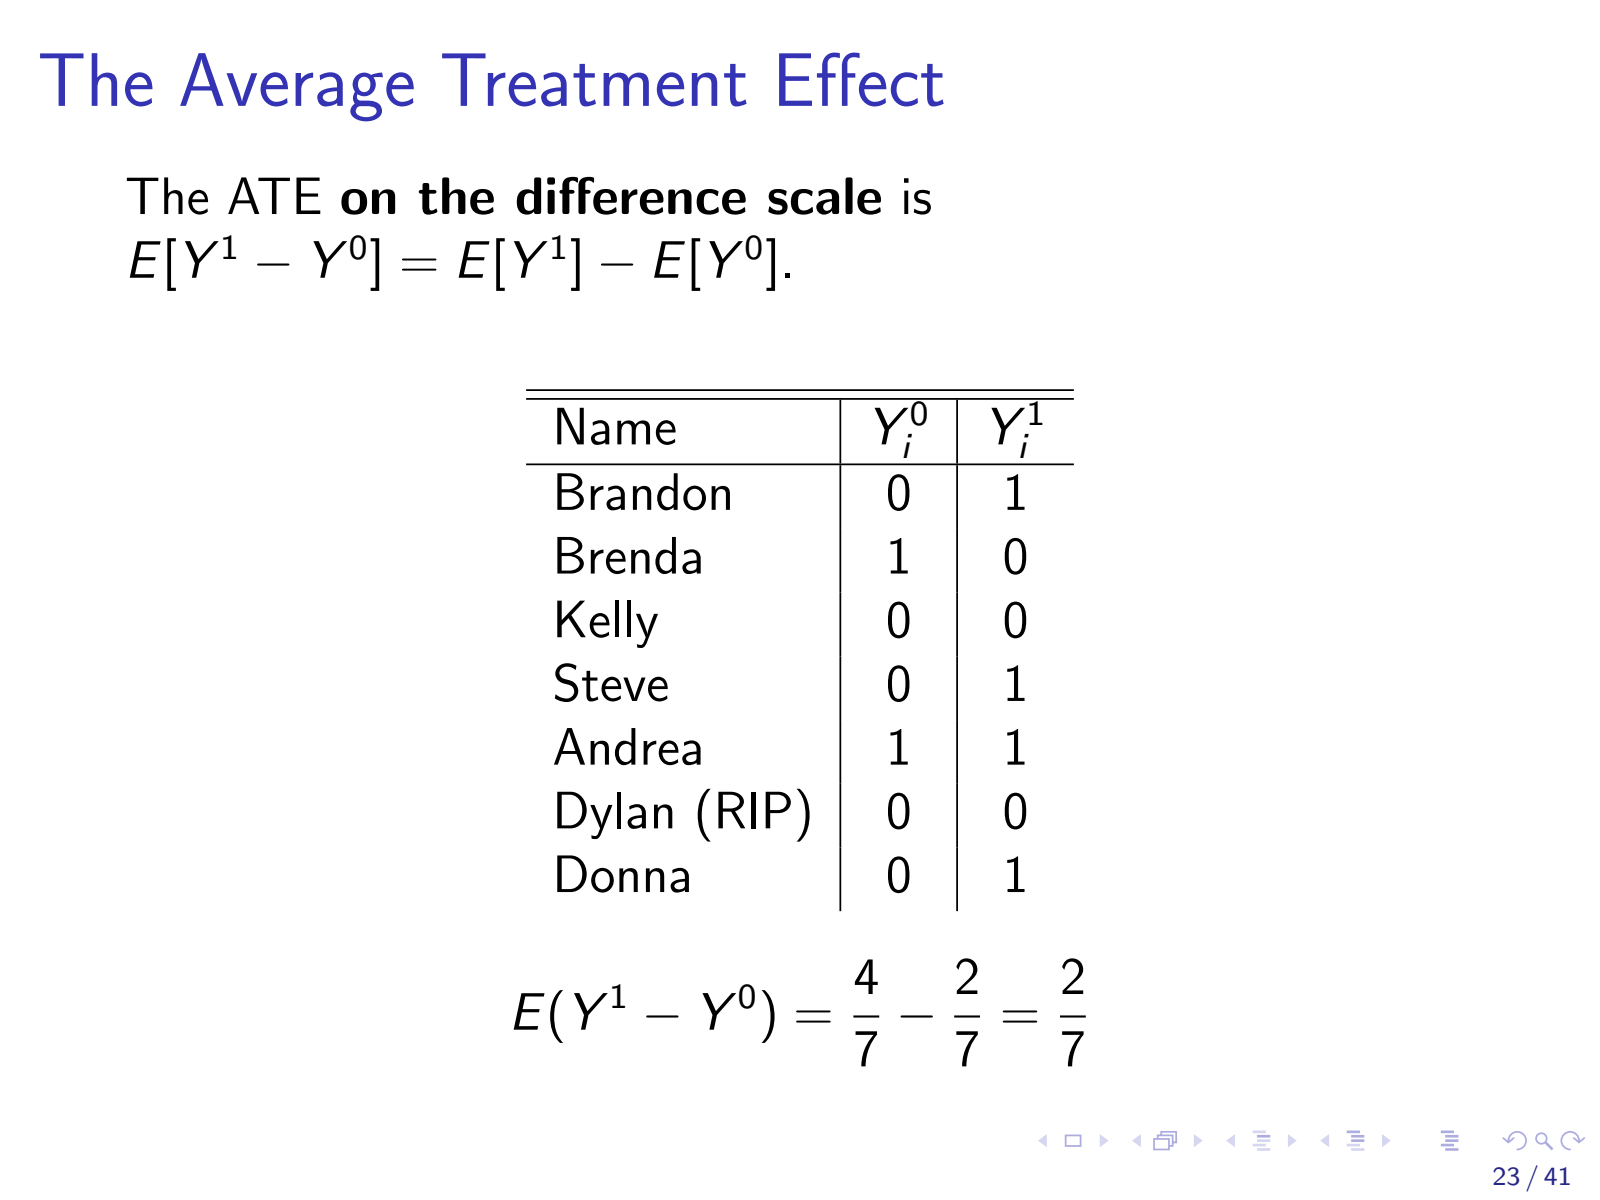
Lecture slide using seven fictional characters' potential outcomes to calculate an average treatment effect of two sevenths. Enlarge ↗
A worked example of the average treatment effect. From the first causal-inference lecture.

Advanced Biostatistical Methods

2018, 2019

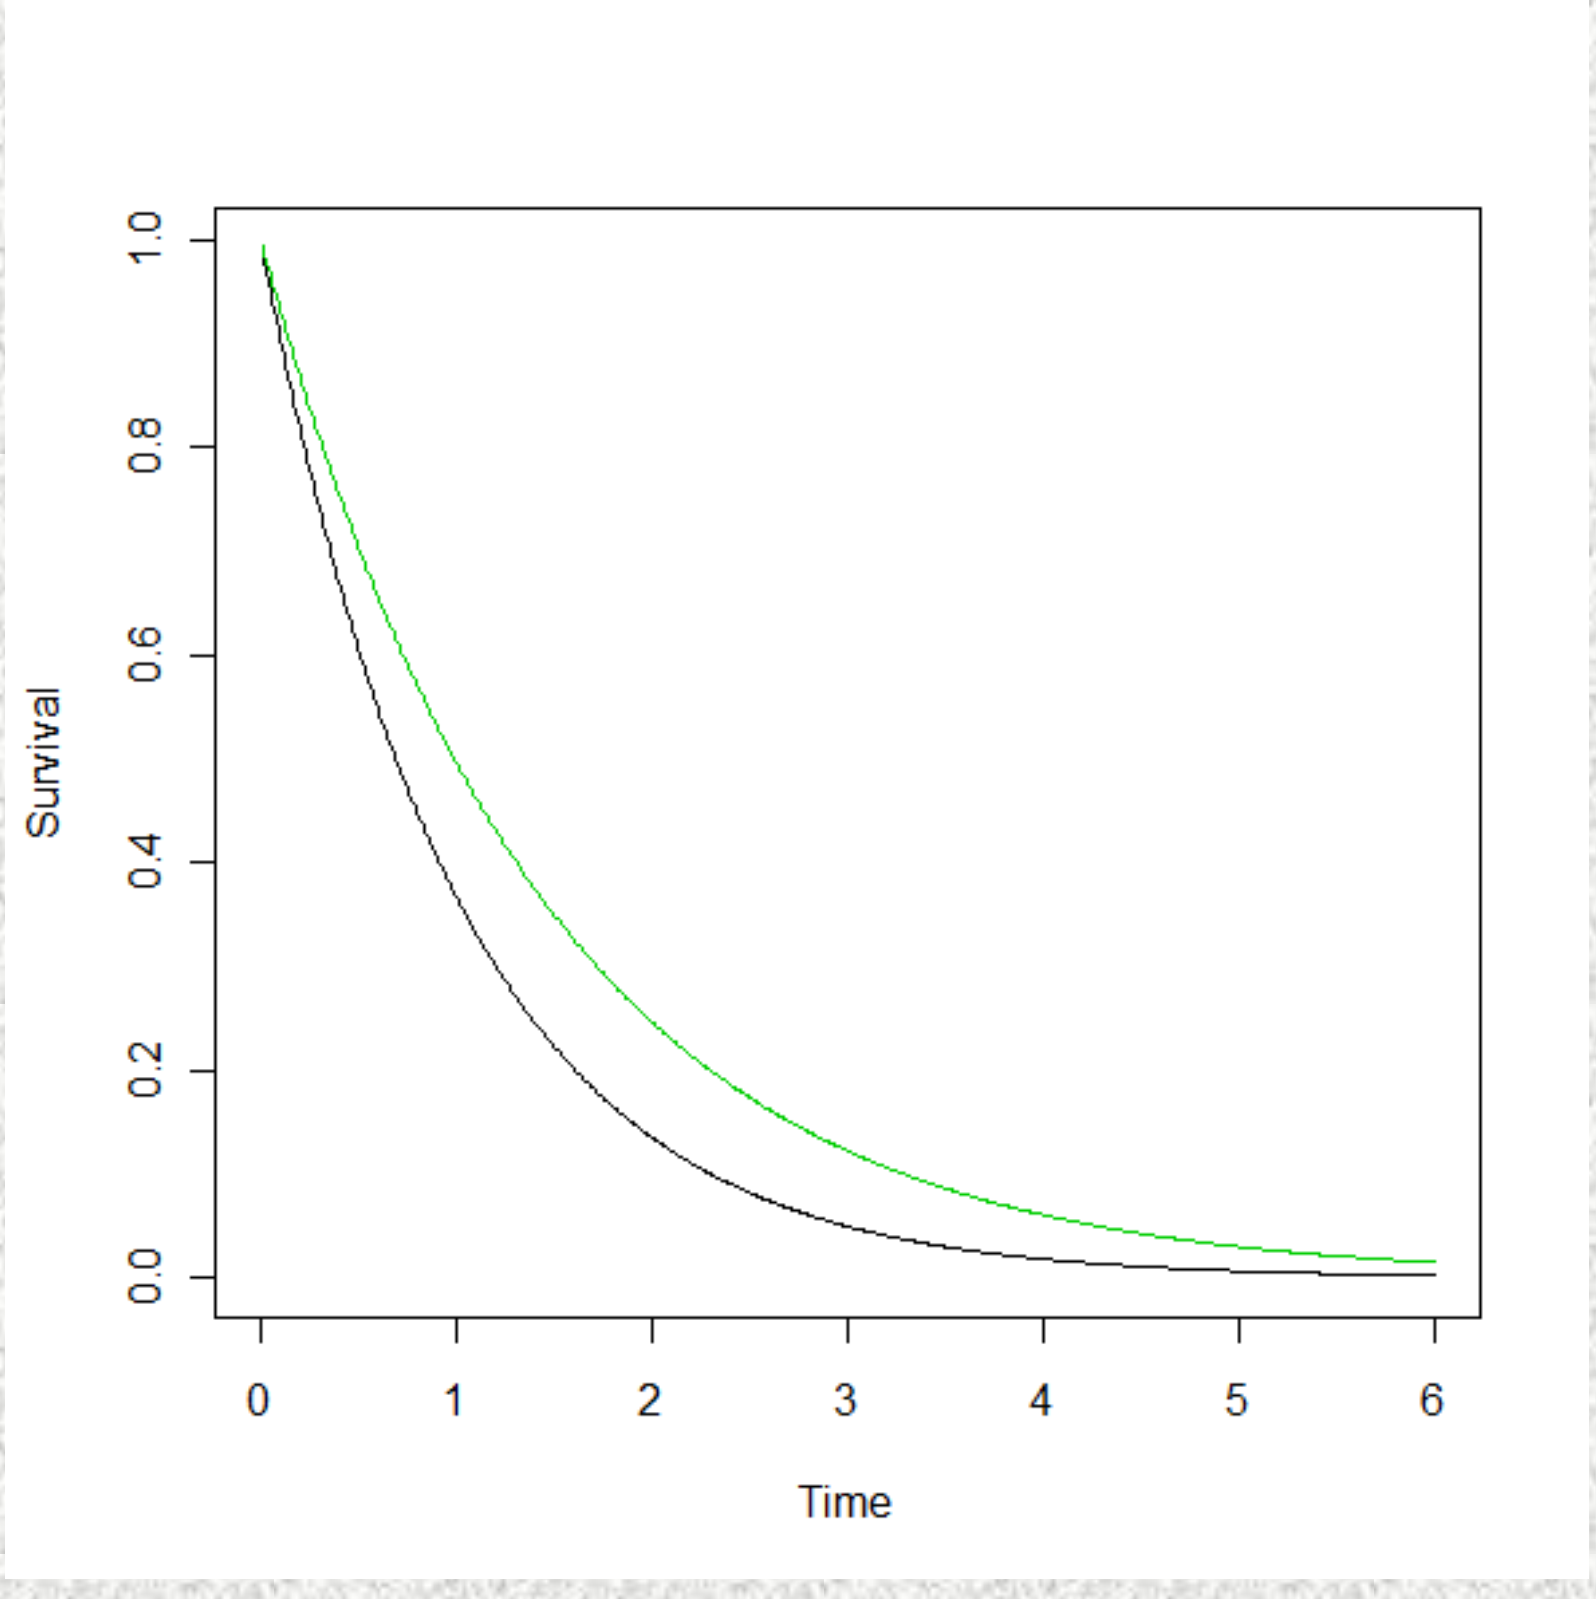
Two survival curves illustrating how a 30 percent reduction in the hazard changes survival over time. Enlarge ↗
From hazards to survival curves. Course slides based on lectures by David Steinberg.
Readings in Causal Inference

Graduate level · 2019

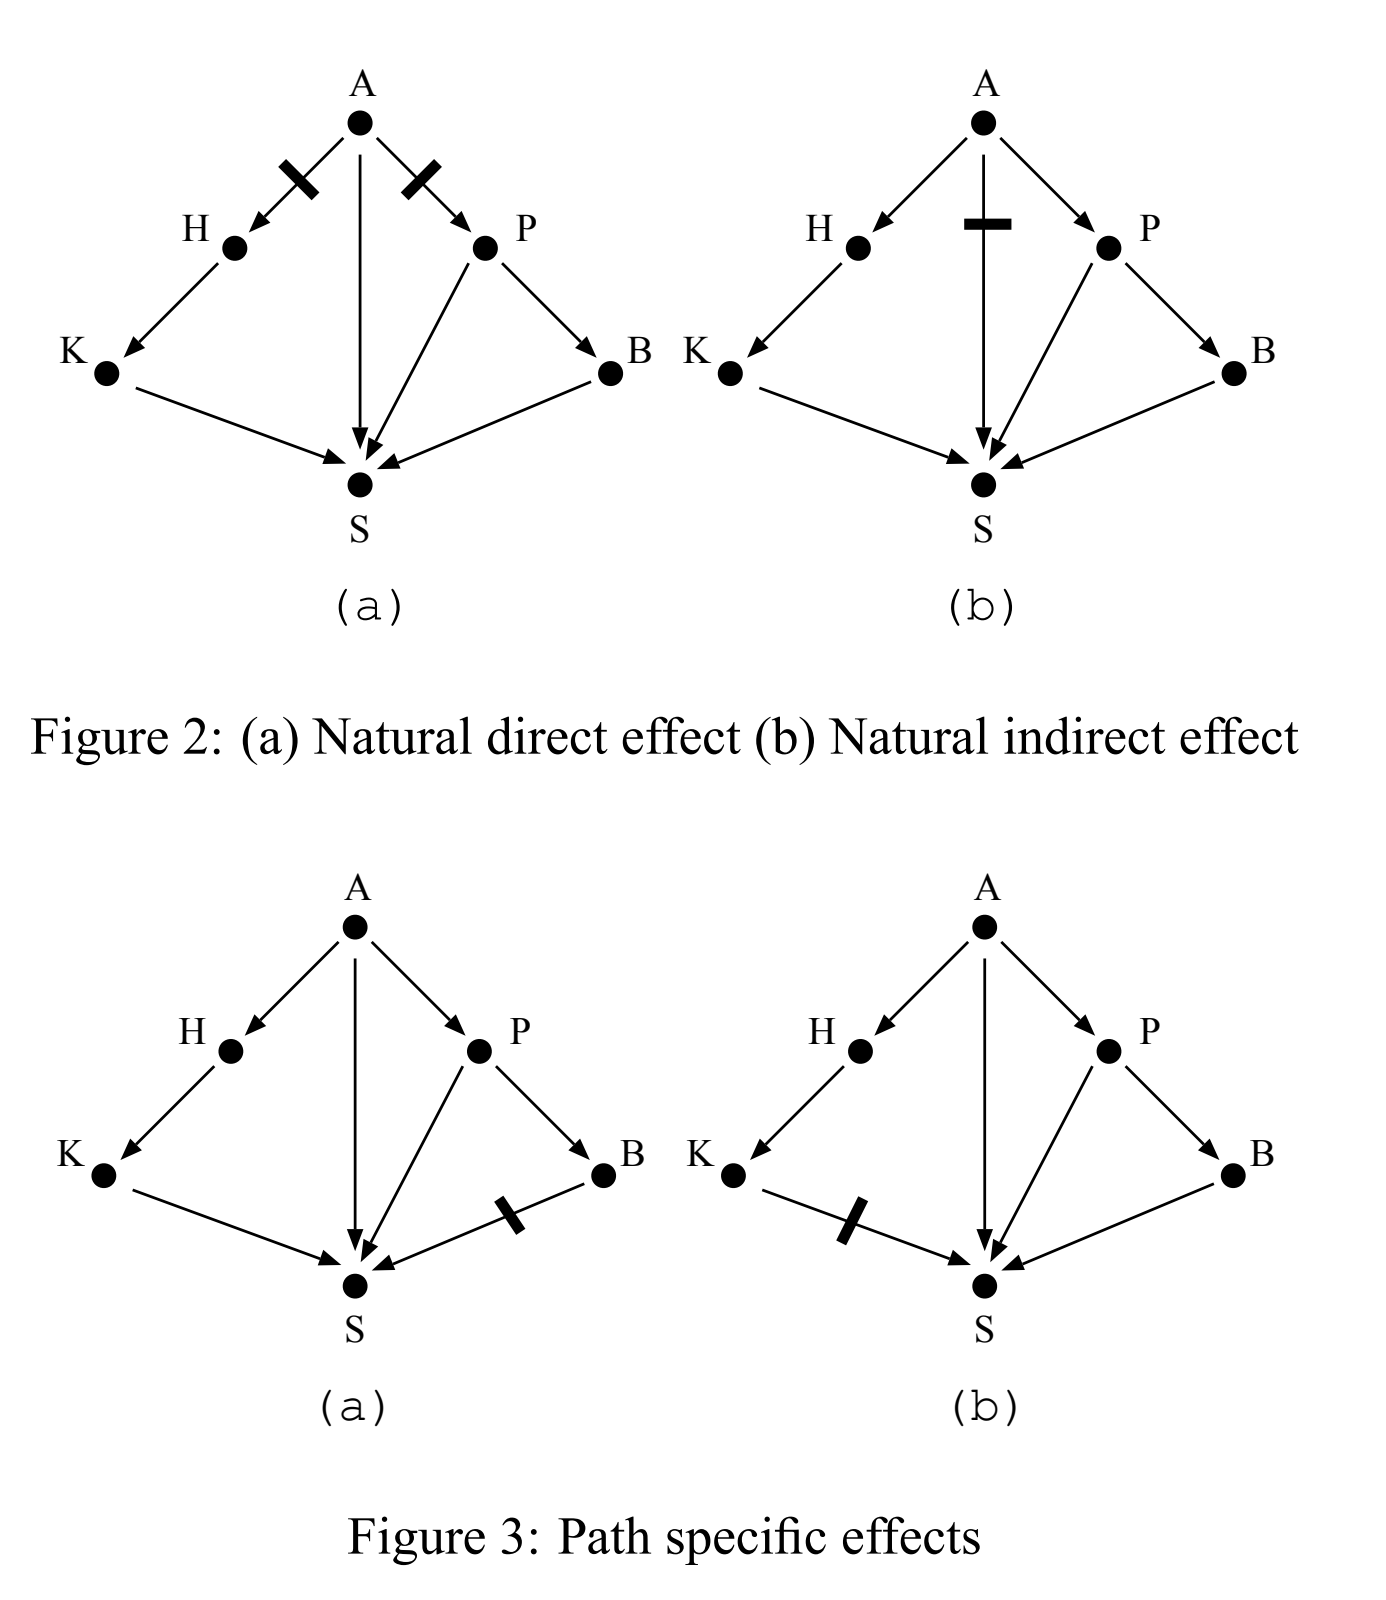
Four causal diagrams illustrating natural direct, natural indirect, and path-specific effects, from Avin, Shpitser, and Pearl. Enlarge ↗
Which pathways carry an effect? Avin, Shpitser & Pearl (2005), Identifiability of Path-Specific Effects, Figures 2–3.
Back to top

© 2026 Daniel Nevo

Department of Statistics and Operations Research · Tel Aviv University

  • TAU profile

  • Privacy